This article has been updated to reflect latest statistics of food and electricity production & consumption.
The UK is made up of approximately 24 million hectares, with just over 13 million of those in England.
Within that area the land use is divided into 13 different categories.
~ Community Service
~ Defence Buildings
~ Industry & Commerce
~ Minerals & Landfill
~ Residential
~ Transport & Utilities
~ Other Developed Use
~ Agriculture
~ Forest, Open Water & Land
~ Outdoor Recreation
~ Residential Gardens
~ Other Undeveloped Land
~ Vacant
Agricultural Land Use
UK Government statistics show that in 2018 there were 8.3 million hectares of land in England used for agricultural purposes. 63% of the total land area.
Let’s take a look at the land uses of a few of England’s different authority areas.
| Authority Area | Total Hectares | Agricultural Hectares | Percentage of Total |
|---|---|---|---|
| Mid Suffolk | 87,105 | 73,262 | 84% |
| Babergh | 61,203 | 46,983 | 77% |
| Ipswich | 4,030 | 428 | 10% |
| City of London | 314 | 0 | 0% * |
| Manchester | 11,564 | 351 | 3% |
| Fenland | 54,735 | 46,854 | 86% (joint highest %) |
| Melton | 48,118 | 41,188 | 86% (joint highest %) |
*City of London was the only authority area to have both a 0% percentage and 0ha of land. There were 10 other authority areas whose % when rounded to the nearest whole number was zero but recorded at least 1ha of agricultural land. Kensington and Chelsea reported 0.2ha of agricultural land.
Mid Suffolk and Babergh show an above average amount of agricultural land compared to the 63% average for England. However, some developed areas have little to zero agricultural food producing land. They are unable to produce their own food, and so rely on other areas like Mid Suffolk and Babergh for their food production.
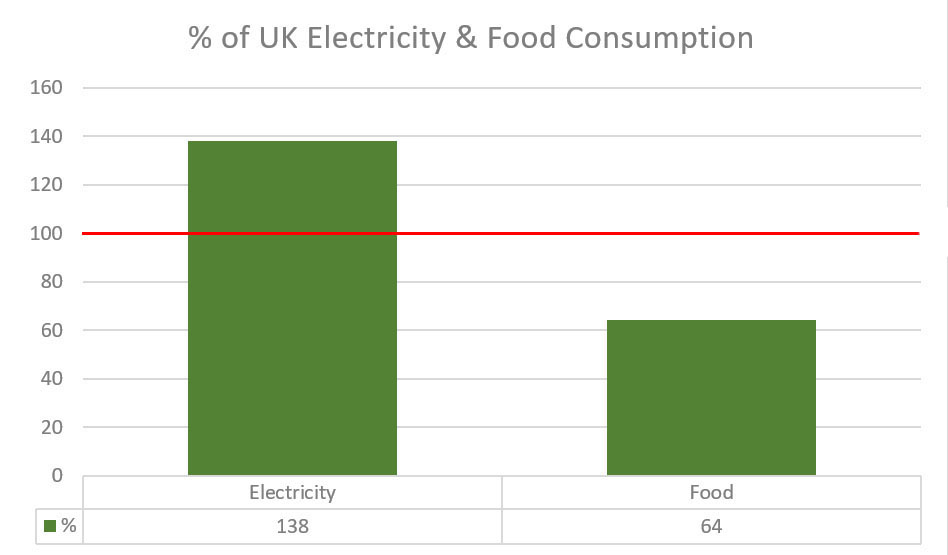
According to UK Government statistics for 2019, the UK produced only 55% of the average household food. If we add back in export tonnage the best the UK could produce for itself is 64% of the total amount of food that it consumed. This means the UK produced 36% LESS food than it consumed, which was topped up by imports.
The agricultural land in the two proposed sites (Enso Energy & EDF Renewables) are both “best most versatile” agricultural land (i.e. the good stuff). They are predominantly for arable crops such as wheat, barley, and oilseed rape. Occasionally sugar beet. In a previous post we covered the amounts of flour and beer that would be removed from the UK’s food production should the solar facilities be built. Enso Energy. EDF Renewables.
In a country that doesn’t produce enough food to feed itself, if we take more land away from agricultural use, not only will this reduce the food security of the areas producing the food, but it will also reduce the security of the areas relying on them to produce it.
Electricity Production
The amount of land that is dedicated to electricity production is (as far as we can tell) not recorded. The majority of it would likely come under the “Utilities” land use, which is 20,474 hectares in England. However utilities covers a wide range. There is also the point that solar covers a lot of rooftops, so is also lost within the various building categories.
What we can look at though is the amount of electricity produced compared to consumption (as we did for food above). According to UK Government statistics for 2019/20 the UK produced 38% MORE electricity than it consumed during peak demand [see page 17 of the document].
2018 was the first year that the UK produced more than half (52%) of it’s electricity from low carbon sources (nuclear, hydro, wind & solar, other renewables), and 33% of this was from renewables (hydro, wind & solar, other renewables) [page 27 of the 2019 document]. The UK’s 2020 target for electricity from renewables was 30%. It achieved this in 2018, and renewables has continued to grow in 2019 and in 2020 set another new record of 37.1% [page 27 of the 2020 document].
Conclusion
Based on the latest figures available (published 2020 for figures of 2019) it seems that the UK is producing more electricity than it consumes, but not enough of it’s own food.
We fully appreciate the need to move away from higher carbon producing forms of electricity (such as coal and gas) towards low carbon and renewable sources. W don’t believe that using agricultural land is the best way to do that though.
As the UK and large parts of Europe entered lockdown in early 2020 due to the COVID-19 pandemic, large numbers of the population lost their jobs and food insecurity greatly increased. And the fragility of the global food network was made wholly visible as something as simple as flour became unobtainable. In a Bramford Parish Meeting in October 2020, Councillor John Field announced that Suffolk’s food banks were handing out 238% more food than before the pandemic.
As the UK enters its third national lockdown due to a new strain of COVID that has already seen countries around the world shut their borders to us, we really must ask, do we really want to be tipping the scales of electricity and food production even more out of balance?
Pingback: Petition to Protect Prime Farmland from Solar Industrialisation – CARE Suffolk